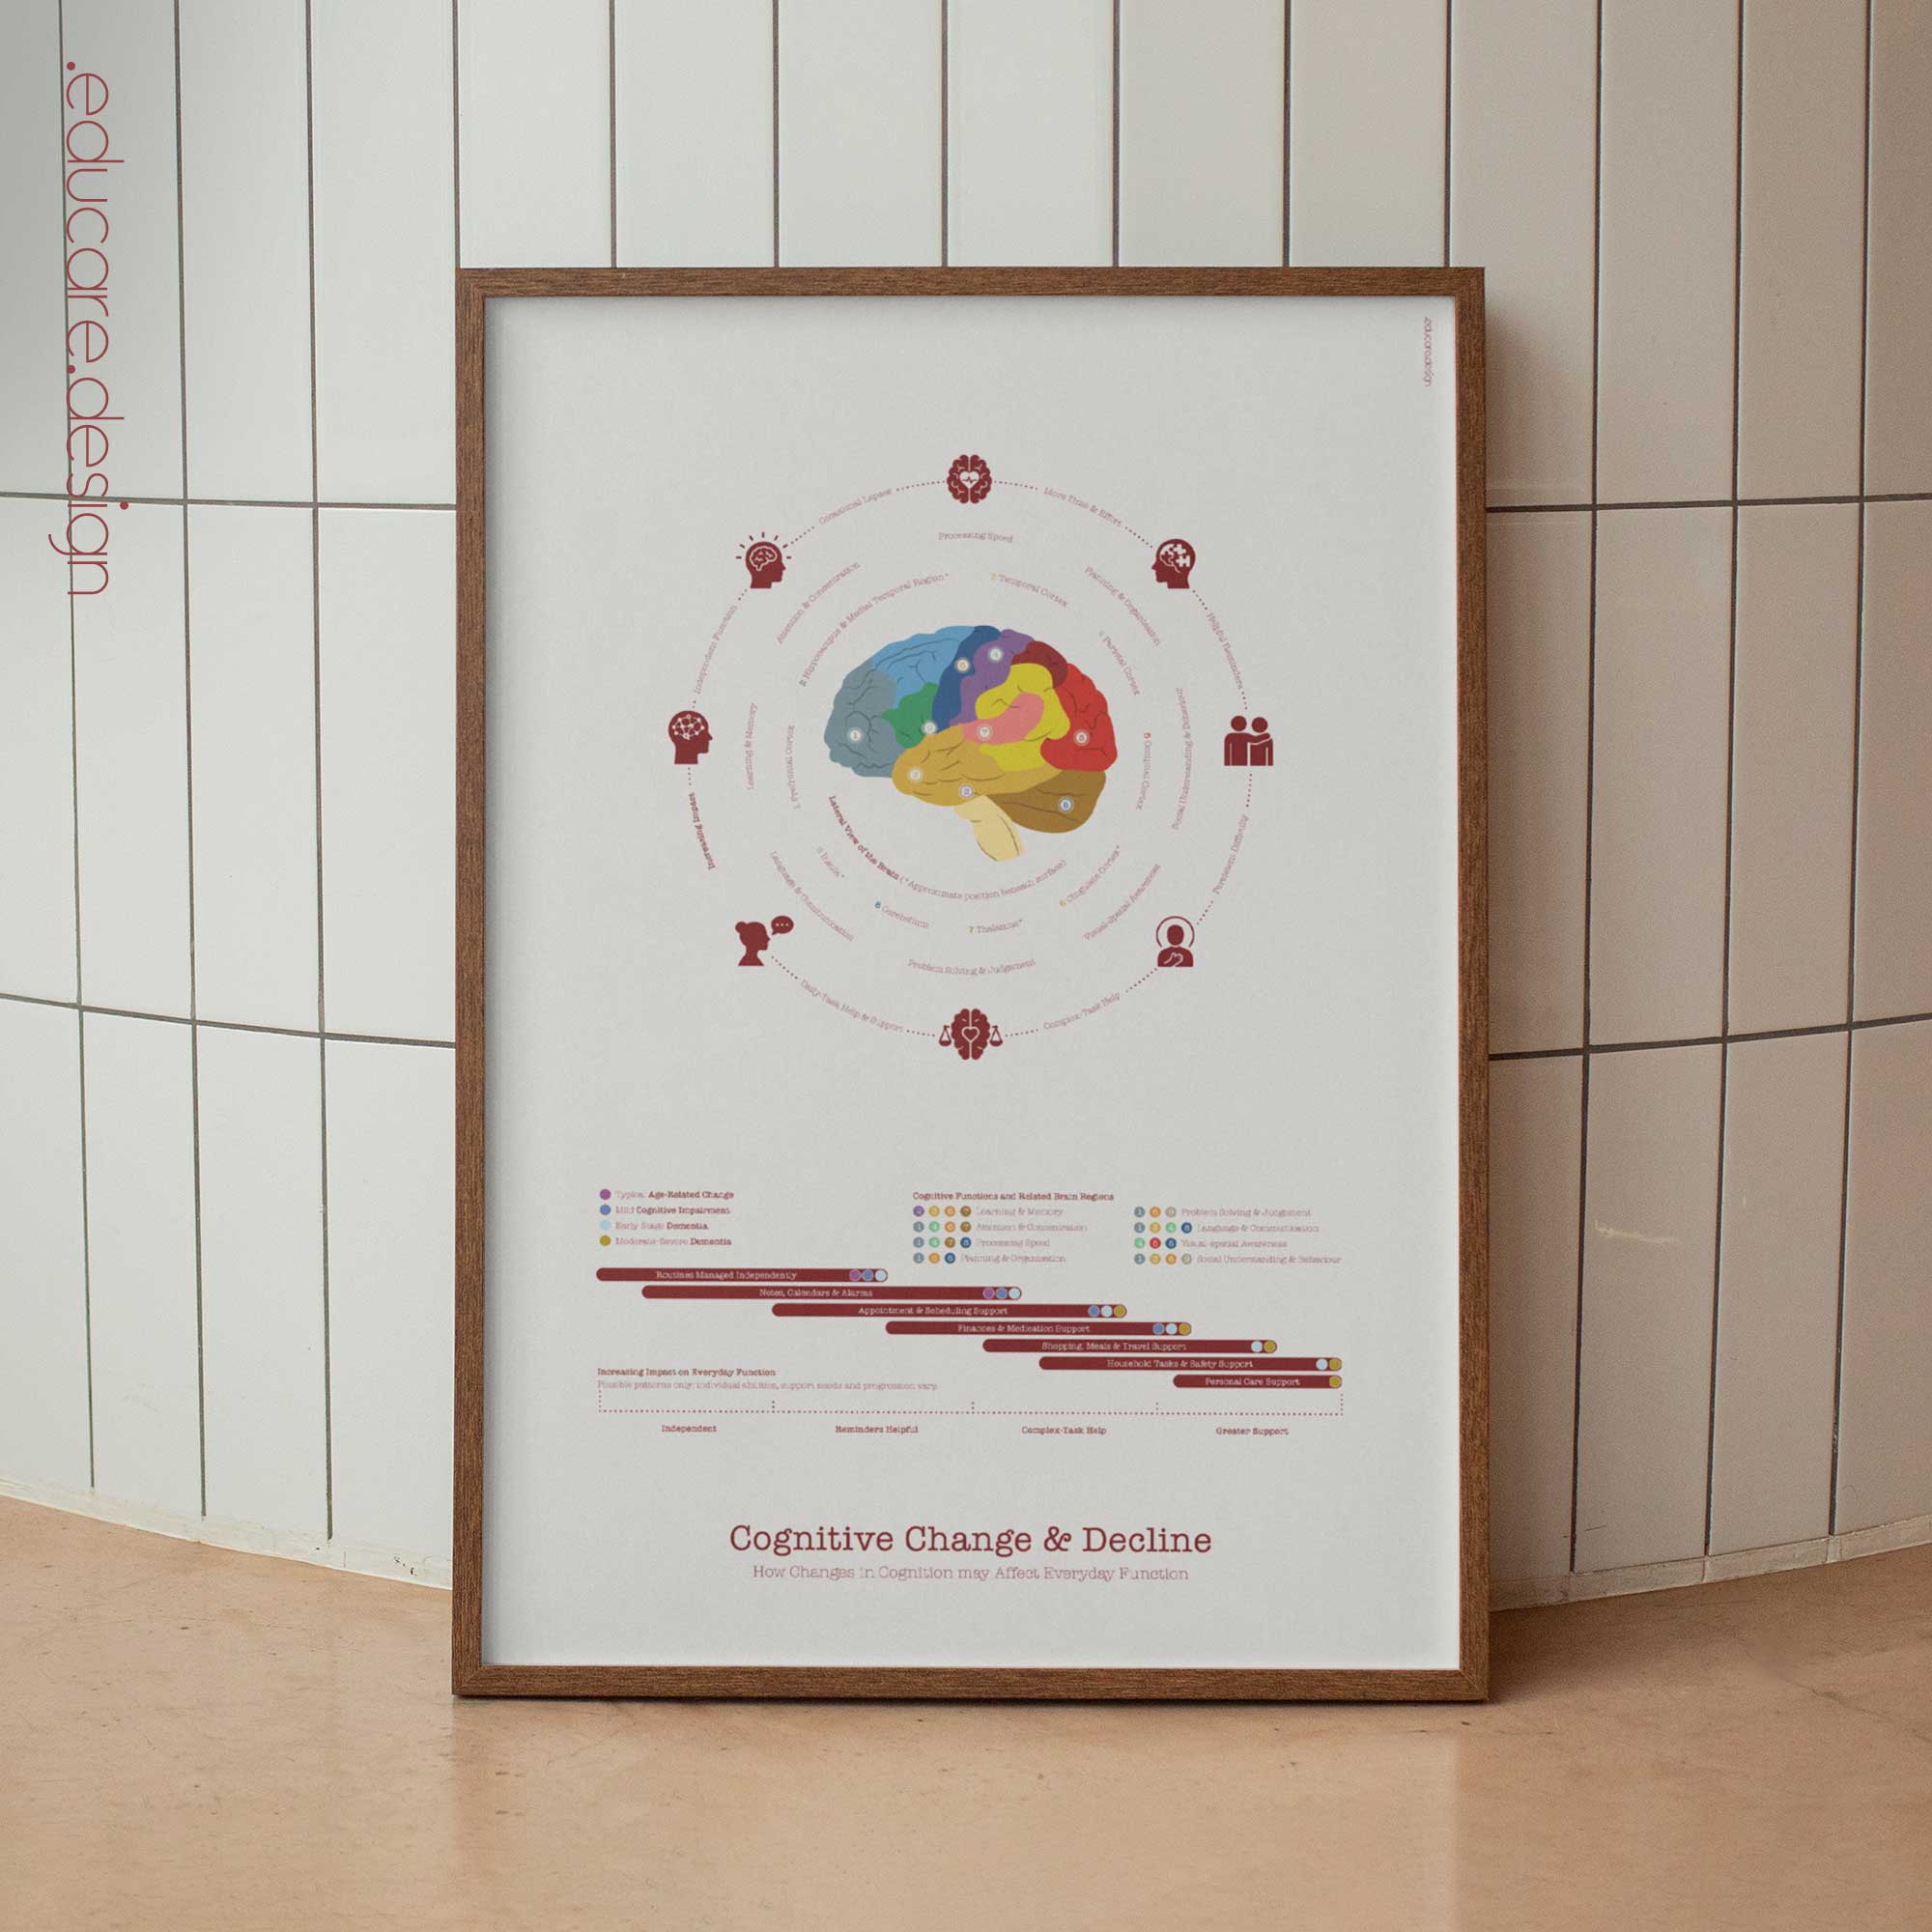
Cognitive Change and Decline is a clear clinical education chart created to help practitioners explain how changes in memory, attention, processing speed, planning, language, visual-spatial awareness and social understanding may relate to brain function and everyday life.
The circular design places a labelled lateral view of the brain at its centre. Nine numbered brain regions are connected to eight cognitive functions, while the surrounding progression shows how changes may move from occasional lapses and additional effort towards reminders, persistent difficulty and support with complex or everyday tasks.
The lower section relates typical age-related change, mild cognitive impairment, early-stage dementia and moderate–severe dementia to overlapping patterns of everyday function. Rounded bars illustrate where different strategies and types of support may become helpful—from notes, calendars and alarms to assistance with appointments, finances, medication, household safety and personal care.
The soft overlaps and explanatory note make clear that individual abilities, support needs and progression vary. The chart presents possible patterns rather than fixed or inevitable stages, making it suitable for calm, non-diagnostic conversations with patients, families, carers and students.
Designed for clinics, teaching spaces and patient education, the chart offers a structured way to discuss both the brain regions involved in cognition and the practical ways cognitive change may affect everyday activities, independence and support needs.
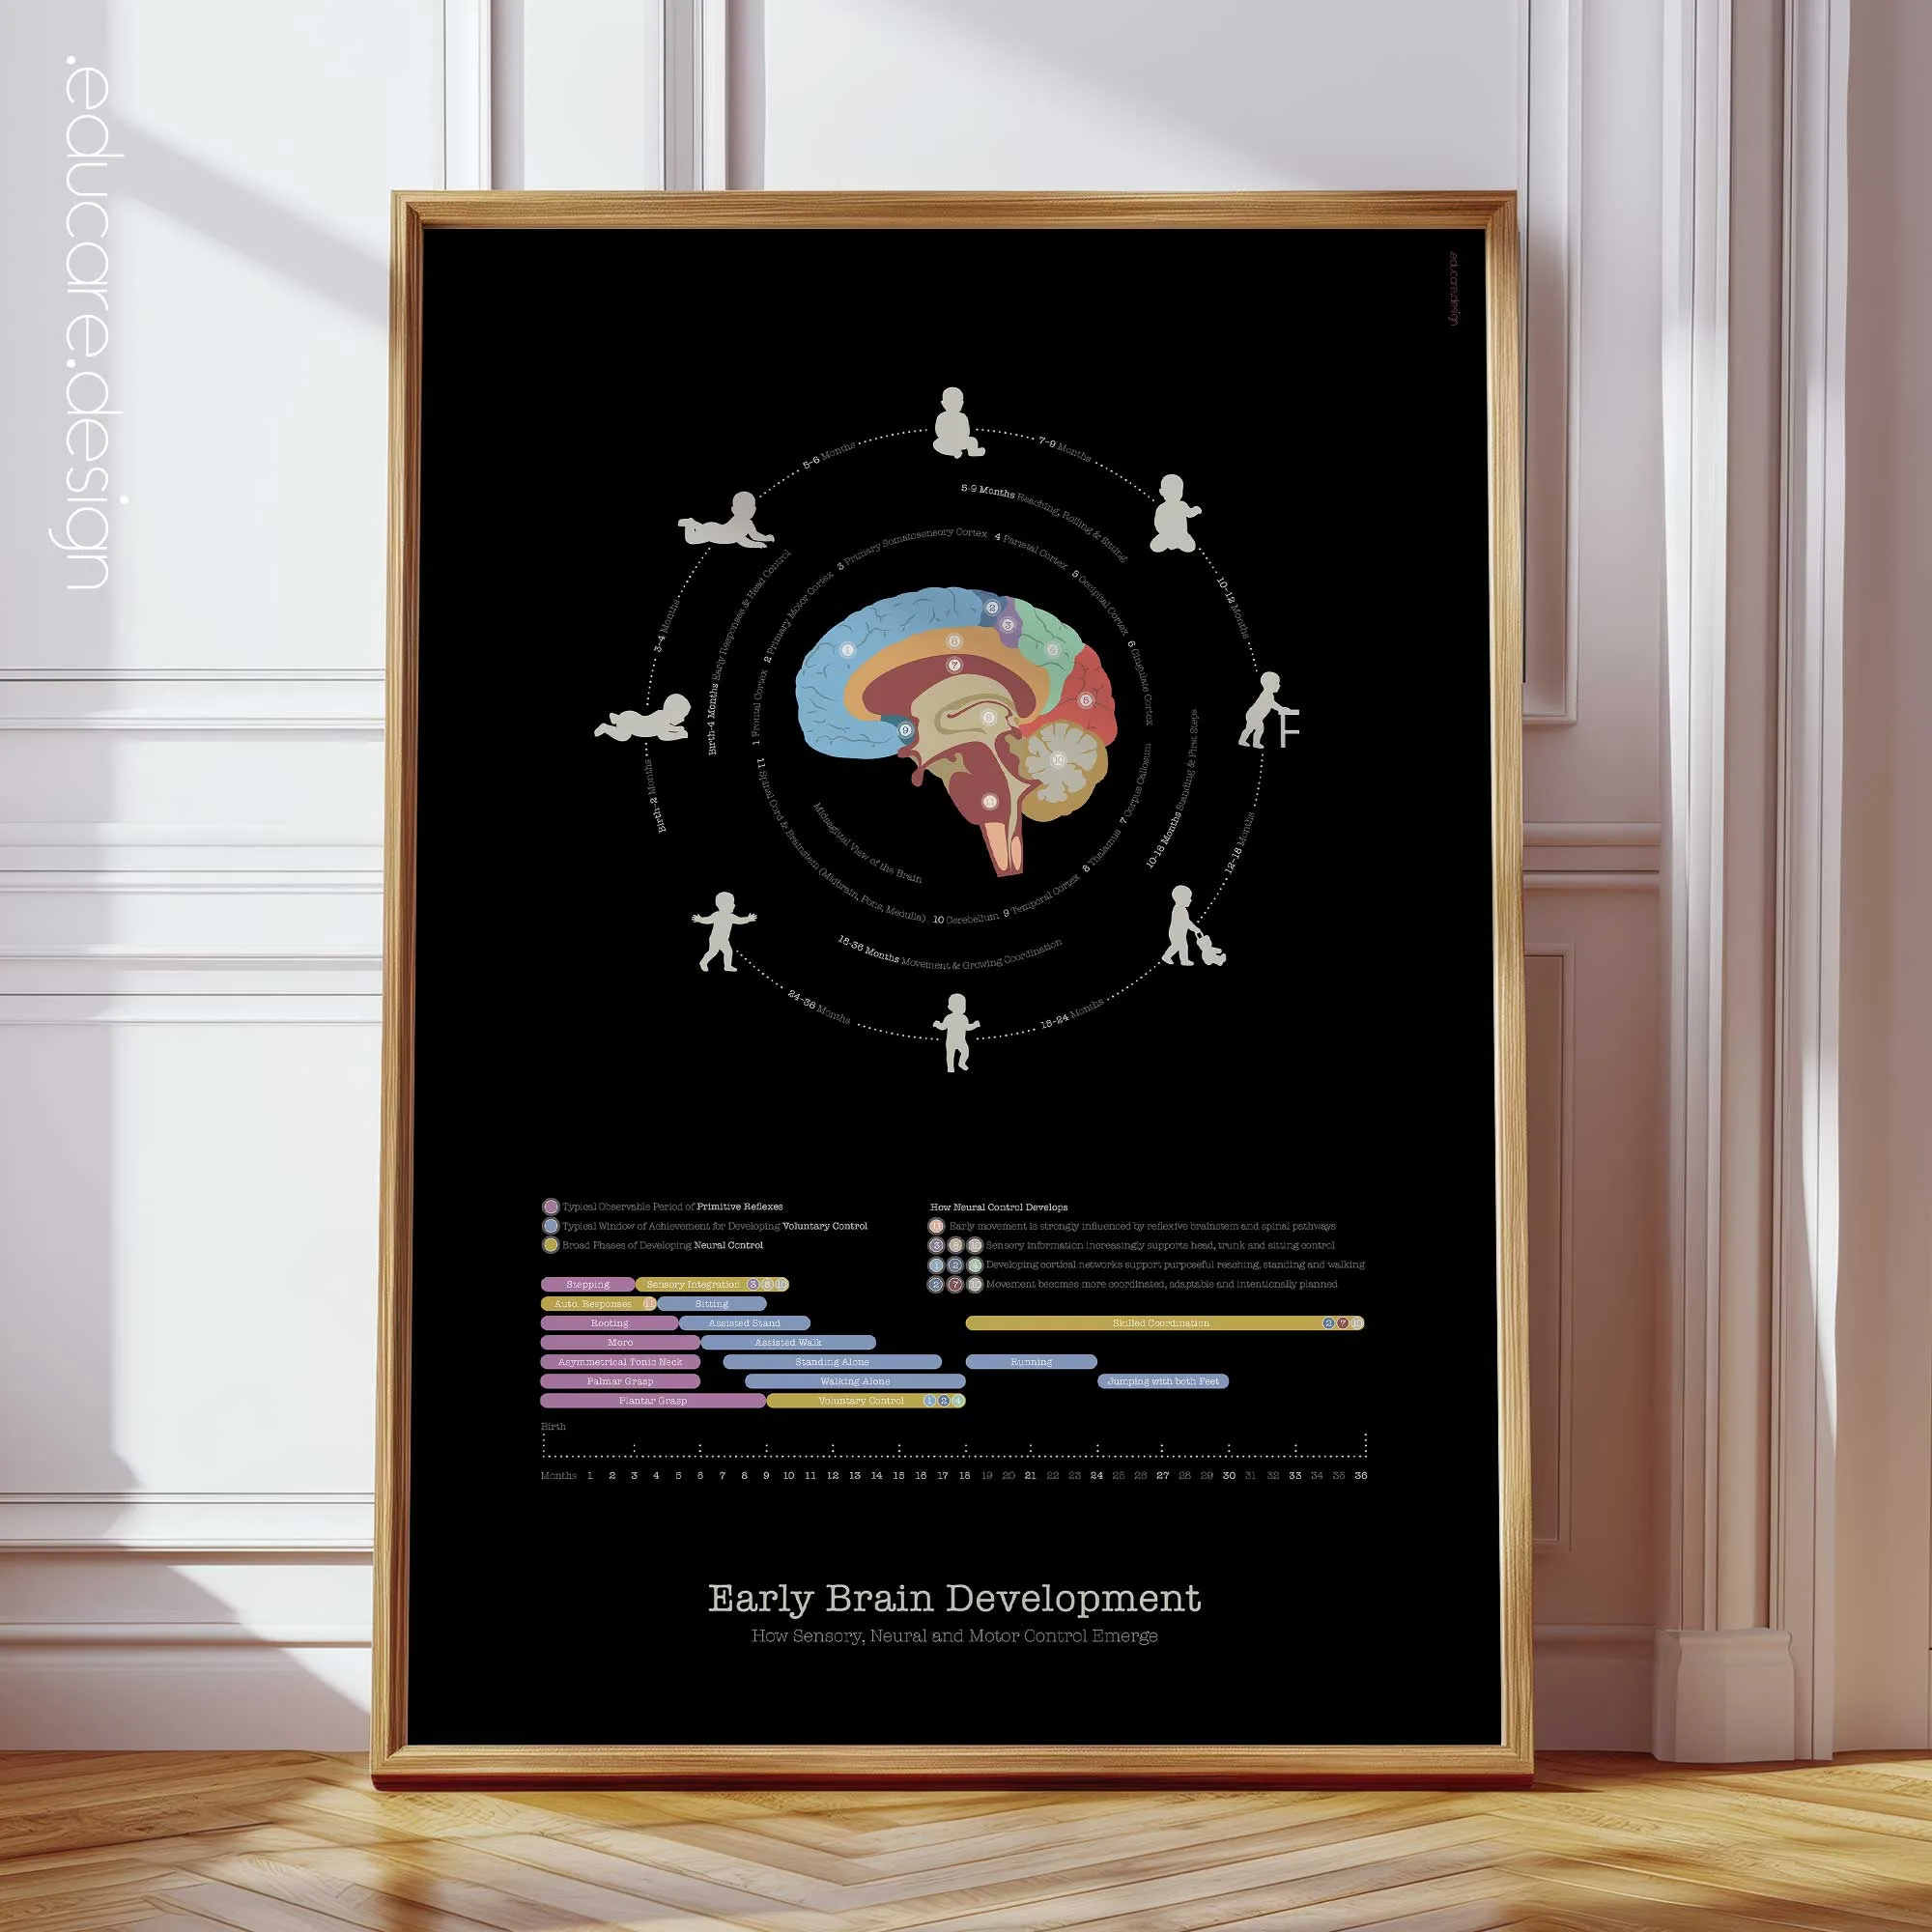
Cognitive Change and Decline works especially well alongside our Early Brain Development chart. The two charts share a brain-centred circular composition, numbered anatomy, burgundy illustrations, a lower progression graphic and matching typography. Displayed together, they create a coherent life-course pair: Early Brain Development shows how sensory, neural and motor control emerge, while Cognitive Change & Decline shows how changes in cognition may affect everyday function. Their matched scale and visual language make the pair particularly effective in clinics, classrooms and teaching spaces. View the two charts hanging together in the image gallery.
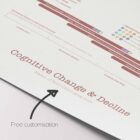
Free customisation with your clinic’s name.
For this artwork we offer to add your clinic’s name (or website address) for free! The name will go instead of the current sub-headline on the artwork; view an illustration of this in the image gallery.
 View this chart here on YouTube.
Black Edition.
This chart is available to order in a special black edition, which can be previewed in the image gallery.
🇬🇧 View more details of the English version.
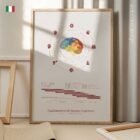
🇮🇹 Vedi i dettagli della versione italiana.
🇪🇸 Ver detalles de la versión en español.
🇩🇪 Details zur deutschen Version anzeigen.
🇫🇷 Voir les détails de la version française.
🇳🇱 Bekijk details van de Nederlandse versie.
🇵🇹 Veja mais detalhes da versão portuguesa.
🇸🇪 Se fler detaljer om den svenska versionen.
🇳🇴 Se flere detaljer om den norske versjonen.
🇩🇰 Se flere detaljer af den danske version.
Make it part of your clinic!
⬇ Order here.